Dr. Imtiaz Rangwala and graduate research assistant, Prasad Thota at the NC CASC have released eight different interactive and easy to use R-Shiny apps to plot and extract data for both observed and future projections of climate change as it pertains to different drought metrics, extreme dry atmospheric conditions and grassland productivity. Users are able to quantify, visualize and download data as .csv files for further analysis. These apps are developed to support quantitative scenario planning in order to more robustly assess the nature of climate change impacts, making them of particular use for researchers and stakeholders. Available on the Climate Adaptation Science Support platform, they are broadly defined as a network of NC CASC scientists and partners that provide climate science support through collaborative research. The US Fish and Wildlife Service, for example, is an important partner that regularly interacts with the NC CASC on species status assessments in a changing climate.
Below is a summary of what these apps can do:
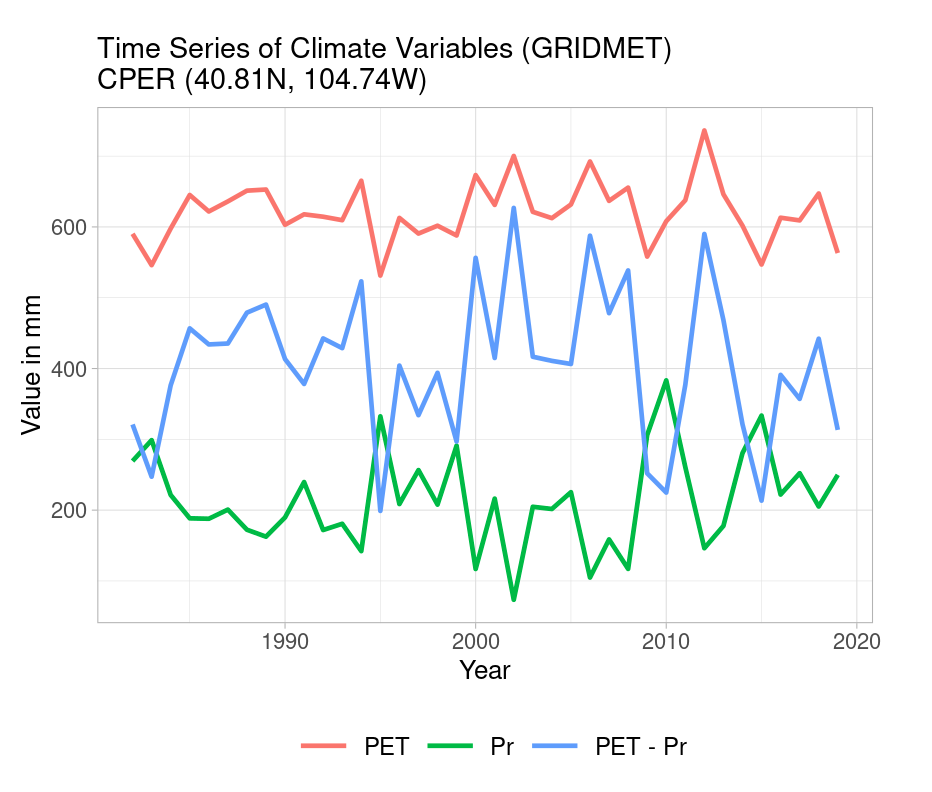
1. Grasslands Productivity and Climate App: Users can understand the observed relationship between grassland productivity and different climate variables (including precipitation and potential evapotranspiration), and project future time series of grassland productivity under different future climate scenarios.
2. Vapor Pressure Deficit (VPD): Users can explore and visualize extremes in “atmospheric thirst” (atmospheric evaporative demand) in recent history (1981 – 2020) and for projections under future climate scenarios for anywhere in the contiguous US.
3. Evaporative Demand (PET): Potential Evapotranspiration is a measure of atmospheric evaporative demand. This app quantifies and visualizes the extremes in PET at different timescales (weeks to months) in the recent historical period (1981 – 2020) for any location within the contiguous US.
4. Climate Futures Toolbox: This R package provides easy access to downscaled climate projections data to support climate change analysis and scenario planning.
5. Standardized Precipitation Index (SPI): This index quantifies standardized departures in precipitation at different timescales (1 to 12-months) projected into the future under different climate scenarios for any location within the contiguous US.
6. Standardized Precipitation Evapotranspiration Index (SPEI): Similar to SPI in terms of timescales, locations and future climate scenarios, this index quantifies standardized departures in the difference between precipitation and potential evapotranspiration (PET).
7. Evaporative Demand Drought Index (EDDI): This index quantifies standardized departures in PET at different timescales and locations. EDDI is an experimental drought monitoring and early warning guidance tool that particularly examines how anomalous the atmospheric evaporative demand (or atmospheric thirst) is.
8. Forest Drought Stress Index (FDSI): This app measures dryness or drought stress across the water year by integrating anomalies in the cold season (Nov – March) precipitation and warm season VPD (Aug-Oct of previous year and May – July of current year). It is particularly important for the western US ecosystems. It turned out to be a sensitive metric for identifying extreme drought years such as 2002, 2021 and 2018 in Colorado.