Climate Projection Tools
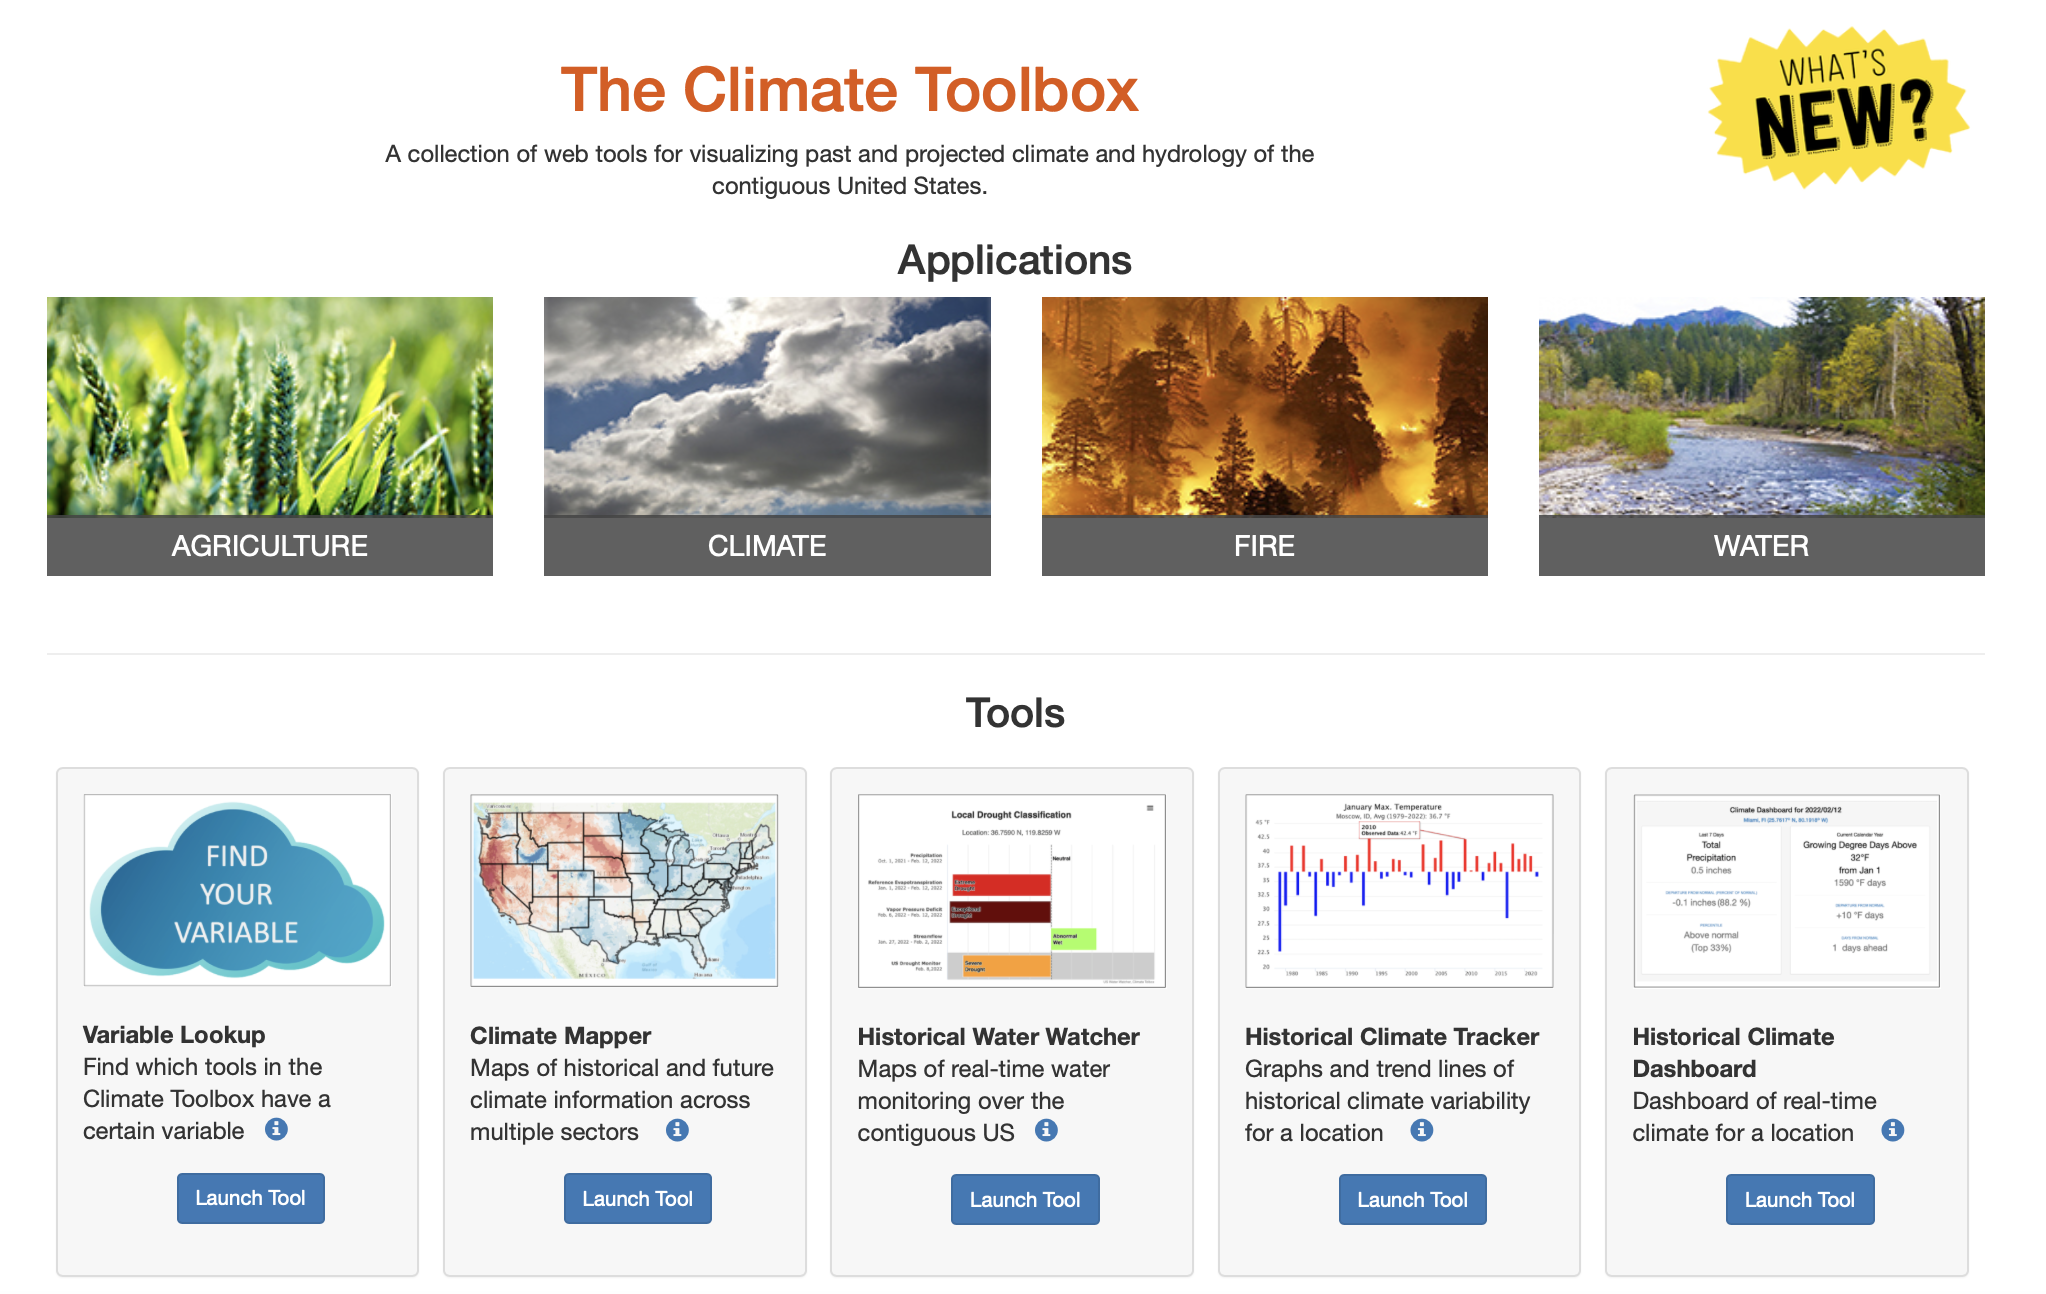
The Climate Toolbox
The Climate Toolbox is a dynamic suite of interactive web tools designed for mapping, charting and analyzing both historical and projected climate and hydrology across the contiguous United States.
Developed by the Pacific Northwest Climate Impacts Research Consortium (CIRC), University of California Merced, USDA Northwest Climate Hub, and other partners, the platform offers over a dozen modules that span applications for water resources, agriculture, fire conditions, climate modeling, and more.
R-Shiny Apps to Plot and Extract Observed & Future Projections Data
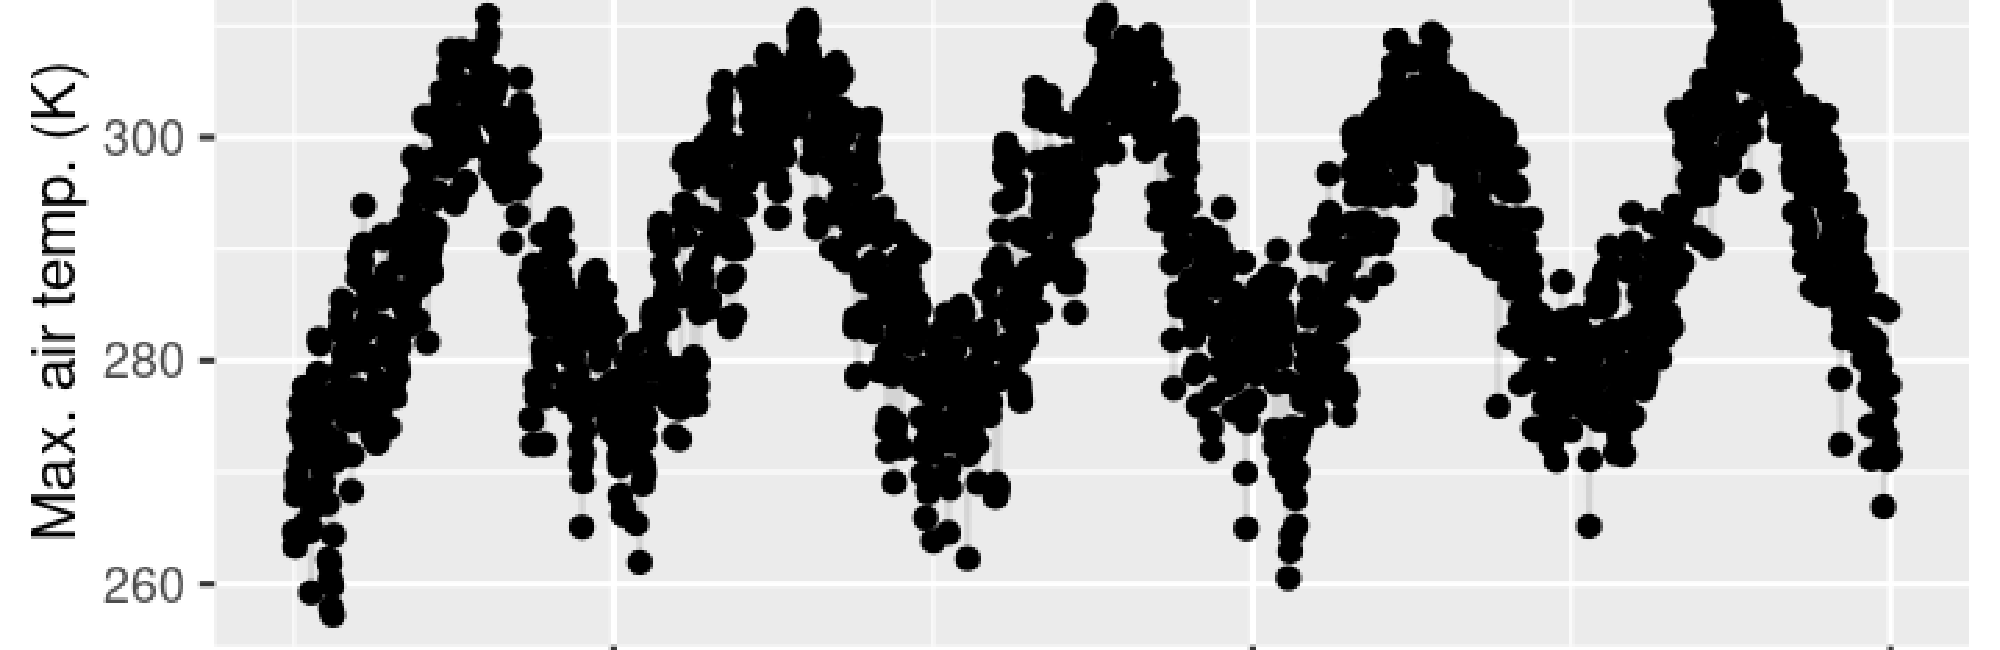
- Grassland Productivity and Climate - Observations & Future Projections
- Vapor Pressure Deficit (VPD) Extremes - Observations & Future Projections
- Evaporative Demand (PET) Extremes - Observations
- Climate Future Toolbox (CFT) - Future Projections
- Standardized Precipitation Index (SPI) - Observations & Future Projections
- Standardized Precipitation Evapotranspiration Index (SPEI) - Observations & Future Projections
- Snowfall and Rainfall Projections
Drought Tools
Drought Index Portal (DrIP)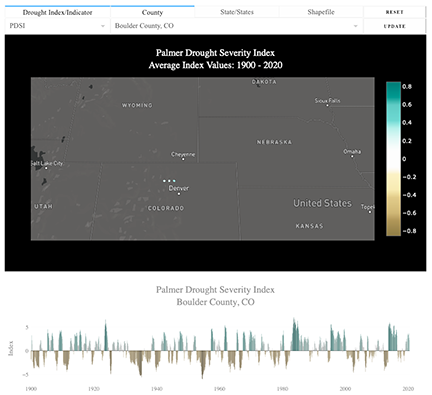
NC CASC and Earth Lab have recently released the Drought Index Portal (DrIP) through the University of Colorado, Boulder. DrIP is a web analytic resource to display, compare, and extract time series for various indicators of drought in the contiguous United States. DrIP was developed to provide a singular portal on which to perform quick visual comparisons of drought indices across time and space, and extract regional time series data. The tool is hosted on the Cooperative Institute for Research in Environmental Studies (CIRES) web platform to be available for broader research support. Read more
SPEI
Future Projections of Standardized Precipitation Evapotranspiration Index (SPEI)are scientific forecasts estimating future drought conditions by analyzing the balance between precipitation and potential evapotranspiration (water loss) under various climate change scenarios(e.g., RCP 4.5 and RCP 8.5). 
Access the dataset here.
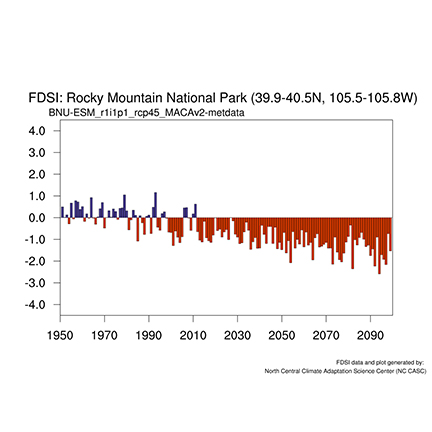
Future Projections of the Forest Drought Stress Index (FDSI)
This script generates an annual time series of the Forest Stress Drought Index (FDSI) for any region in the Contiguous United States between 1950-2099 using monthly projections of precipitation and vapor pressure deficit from MACAv2-metdata. Only inputs to the script required include: (i) identification of the GCM and the emissions scenario (RCP 4.5 or RCP 8.5), and (ii) the latitude and longitude boundaries of the region.
R-Shiny Apps to Plot and Extract Observed & Future Projections Data