The November/December 2020 issue of our newsletter is available online
The November/December 2020 issue of the NC CASC newsletter is available online.
Article in Nature: How to include Indigenous researchers and their knowledge
An article, "How to include Indigenous researchers and their knowledge" was published by Nature on January 12th.
Shelley Crausbay Featured Speaker in Upcoming Ecological Drought Webinar Series
A four-part Ecological Drought National Webinar Series, hosted by NIDIS, USGS, and the NC CASC is taking place in February and March 2021. Shelley Crausbay, Conservation Science Partners and NC CASC, is speaking at the first of four webinars.
James Rattling Leaf, Sr. Featured as Panelist at American Meteorological Survey 101st Annual Meeting
James Rattling Leaf, Sr. will be a panelist in the American Meteorological Survey (AMS) 101st Annual Meeting, which is taking place January 10-15th.
Read the Latest Tribal Climate Newsletter
The January 2021 edition of the Tribal Climate Newsletter was released.
James Rattling Leaf, Robin O’Malley & Chad McNutt receive Rising Voices project funding award
Congratulations to James Rattling Leaf, Robin O’Malley and Chad McNutt who have been awarded seed funding from Rising Voices for their project "Enabling Tribal Data Sovereignty: Supporting Great Plains and Northern Rockies Tribes Data Needs".
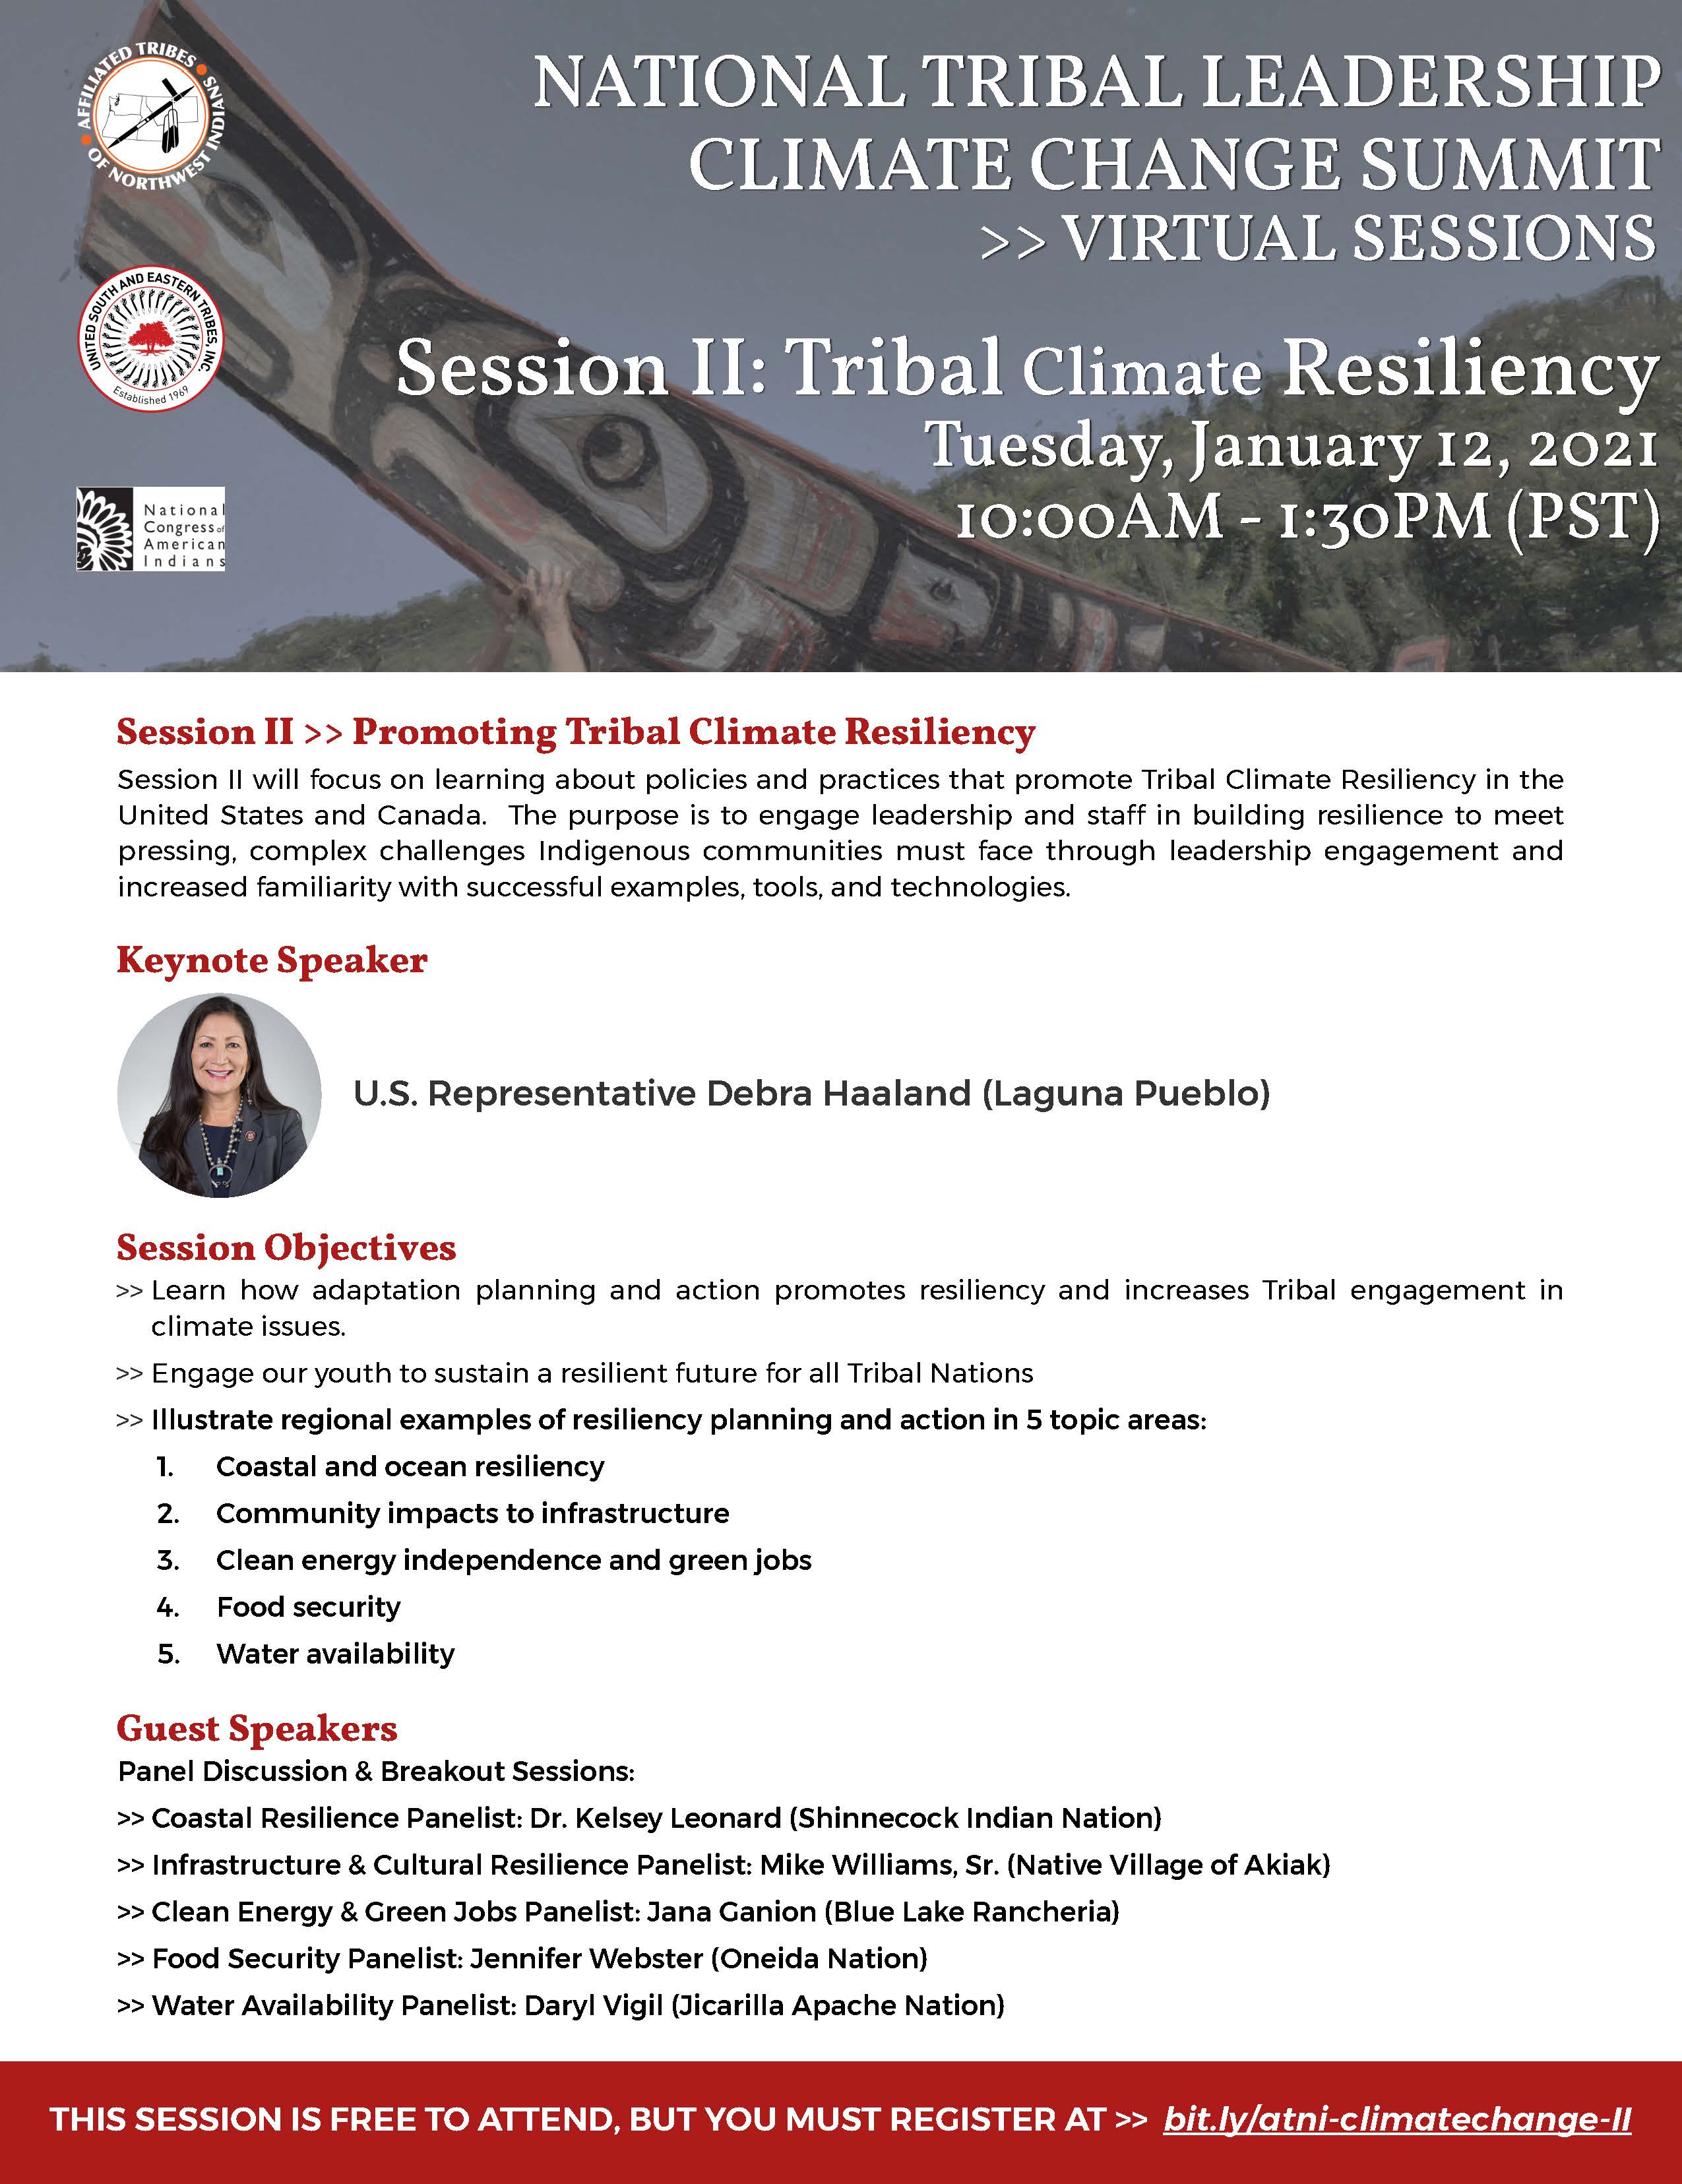
U.S. Representative Debra Haaland (Laguna Pueblo) added as keynote speaker to ATNI's National Tribal Leadership Climate Change Summit Session II: Tribal Climate Resiliency
Contact Us
Want to see more? Do you have feedback? Was this site helpful? Send us an email!