The CASC Futures Forum
On November 18 - 22, 2024, scientists and staff from the North Central Climate Adaptation Science Center (NC CASC) attended the CASC Futures Forum in San Diego, California.
Welcome to Dr. Alex Shupinski!
The NC CASC welcomes Alex B. Shupinski, a postdoctoral researcher at South Dakota State University. She is currently conducting species distribution modeling on Bison to help predict their future habitat suitability across North America with the changing climate.
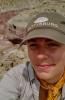
Alex B. Shupinski
Conserving Central Grasslands and Keystone Species
North America’s Central Grasslands are among the most endangered ecosystems in the world. They face a suite of conservation challenges associated with habitat loss, transformation, and fragmentation. Learn more in this Science Spotlight, featuring Ana Davidson from new NC CASC consortium partner, Colorado State University.
Upcoming Webinar: Dreams from the Anthropocene
Our next webinar is on Thursday, December 12, from 11 AM - 12 PM MT. Hear from Robin Hextrum, an artist and environmentalist, about the role of art in processing and raising awareness about the impacts of climate change.
Webinar Recording Now Available
Although the lynx is designated a species of least concern by the International Union for Conservation of Nature, it has been listed in the contiguous U.S. as a threatened distinct population segment (DPS) since 2000. Learn more about the threats that climate warming poses to this species.
When
Robin Hextrum has been making paintings that address climate change since 2011. Throughout these years, her work has evolved in various ways, but it always returns to environmental concerns. Many of her paintings utilize a surrealist juxtaposition of incongruous elements to call attention to climate issues. For example, combining icebergs with opulent imagery from traditional Dutch paintings asks us to examine the historical legacy and environmental impacts of our ever-demanding needs for material wealth. And, her paintings of animals taking over prestigious human spaces like museums and palaces ask viewers to rethink the dominance of human centered narratives. We now live in a new geological epoch known as the “Anthropocene.” This period refers to the significant human impact on species extinction and the climate since 1950. It is difficult to comprehend this degree of harm and responsibility. Hextrum believes art provides a valuable platform for processing the existential threat of climate change that can be both healing and transformative in its call to action.
Sagebrush Workshop Report now available
On August 20-21, 2024, sagebrush experts and partners joined the NC CASC for a workshop in Boulder, Colorado. Read the workshop report to learn more about objectives and outcomes!
Jeff Martin of South Dakota State University (NC CASC Consortium Partner) highlighted in press release
Jeff Martin is leading South Dakota State University’s involvement with the NC CASC/USGS in our recently-renewed cooperative agreement - read more about his work in SDSU's recent press release.
Contact Us
Want to see more? Do you have feedback? Was this site helpful? Send us an email!