NC CASC Partners Co-Author Paper: "Challenges to Forest Restoration in an Era of Unprecedented Climate and Wildfire Activity in Rocky Mountain Subalpine Forests"
NC CASC consortium partners, Phil Higuera, University of Montana, and Shelley Crausbay, Conservation Science Partners (CSP), are co-authors on a new paper, "Challenges to forest restoration in an era of unprecedented climate and wildfire activity in Rocky Mountain sub
NC CASC May 2022 Tribal Climate Newsletter Now Online
The NC CASC May 2022 Tribal Climate Newsletter is now available online:
GPTWA Seeks Applicants for Tribal Climate Resilience Liaison II Position
The Great Plains Tribal Water Alliance is hiring for a full-time Tribal Climate Resilience Liaison. The Liaison will connect climate change resources, tools, and information to tribal resource managers and partners to support resiliency-building efforts across the North Central region (MT, WY, CO, ND, SD, NE, KS). For more information about the position, including how to apply, click here.
R-Shiny App to Project Daily Snowfall and Rainfall
The NC CASC Climate Science Support Platform has developed a new R-Shiny app to quantify daily snowfall and rainfall quantities from total daily precipitation data in both observations (gridMET) and future projections (MACAv2-METDATA). Often the observed and projected precipitation data do not distinguish between snowfall and rainfall. Based on our best current understanding, this new application uses relationship between the phase of precipitation and the temperature and relative humidity metrics to quantify proportion of daily precipitation falling as rainfall or snowfall.
Dr. Christy Miller-Hesed to Co-facilitate "Climate Change and Climate Adaptation Training for Grasslands Conservation Practitioners"
North American grasslands are a regional priority of the U.S. Fish and Wildlife Service (FWS). The South Central CASC, in partnership with the US FWS Science Applications Program, the Northwest CASC, and the North Central CASC, will be implementing a training series for grasslands conservation practitioners starting in May 2022. Through our training series, we will introduce practitioners to the science of climate change, explore the impacts, and discuss adaptation options available.
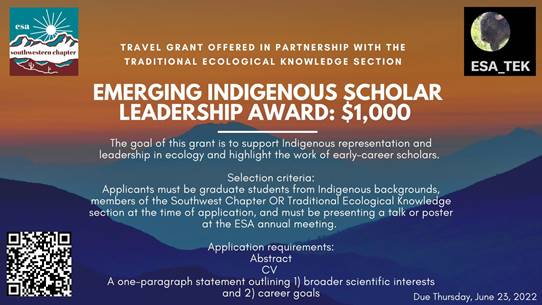
ESA Announces Emerging Indigenous Scholar Leadership Award
WCS Co-authors Study on Climate Adaptation
NC CASC consortium partner, Wildlife Conservation Society (WCS), has co-authored a study on climate adaptation, "Strengthening monitoring and evaluation of multiple benefits in conservation initiatives that aim to foster climate change adaptation".
NC RISCC Network Share First Management Challenge: " Invasive Grass-Fire Cycle in the North Central US"
The North Central Regional Invasive Species & Climate Change Network, NC RISCC, has shared its first Management Challenge, " Invasive Grass-Fire Cycle in the North Central US".
Brian Miller to Co-present "Scenario Planning as a Climate Change Adaptation Tool" webinar
NC CASC/USGS Research Ecologist Brian Miller, Gregor Schuurman, NPS Climate Change Response Program and Amy Symstad, USGS will co-present "Scenario Planning as a Climate Change Adaptation Tool" as part of the National Park Service (NPS) Natural Resource Stewardship and Science Monthly Webinars:
Wednesday, May 11, 2022
3:00 pm EDT / 2:00 pm CDT / 1:00 pm MDT / 12:00 pm PDT
Recent paper by Christy Miller-Hesed Explores Cultural Knowledge and Goals for Environmental Monitoring
Contact Us
Want to see more? Do you have feedback? Was this site helpful? Send us an email!